
How Flexible Should You Be for Your Age? Sit-and-Reach Norms Explained
Age- and sex-specific sit-and-reach percentiles, what they really measure, and why a reference score is not a medical target.

There is no medical rule saying a 40-year-old “should” be able to touch their toes or that a 60-year-old should reach a certain distance past them. Flexibility varies with anatomy, training history, measurement technique and the joint being tested.
But population reference data can still be useful. Statistics Canada has published age- and sex-specific percentiles for the sit-and-reach test, giving us a large, standardized set of reference values. Used carefully, those percentiles can answer a better question: how does my result compare with people of a similar age and sex in this Canadian reference sample?
Where these reference values come from
The table below uses Statistics Canada's Canadian Health Measures Survey, cycle 5 (2016–2017). The published table provides percentiles from P5 to P95 in centimetres for age bands and sex. That makes it a high-quality national reference dataset, but it is still Canadian data collected with a particular protocol. It should not be treated as a universal biological standard for every population.
The median changes with age — but not overnight
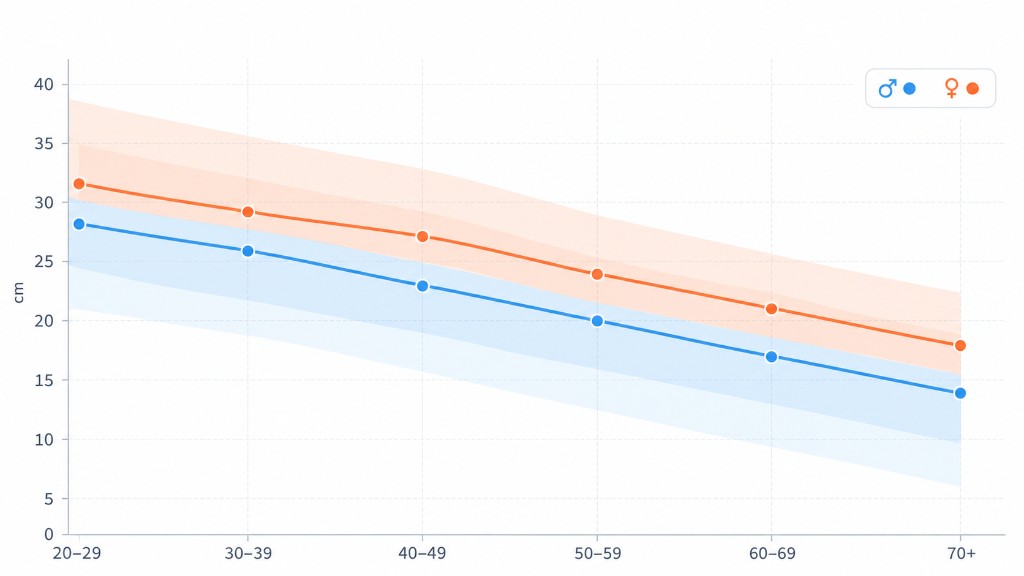
Among males, the estimated median falls from 24.6 cm at ages 20–24 to 20.3 cm at ages 65–69. Among females, the median is around 31.1 cm at ages 20–24 and 28.9 cm at ages 65–69.
The pattern is more gradual than the common idea that flexibility suddenly disappears after 30 or 40. Population averages shift, but individuals can remain above or below those curves at every age.
Selected adult sit-and-reach percentiles
| Age | Male P10 | Male P50 | Male P90 | Female P10 | Female P50 | Female P90 |
|---|---|---|---|---|---|---|
| 20–24 | 11.7 cm | 24.6 cm | 37.2 cm | 18.3 cm | 31.1 cm | 42.6 cm |
| 30–34 | 11.5 cm | 24.2 cm | 36.6 cm | 17.5 cm | 31.0 cm | 43.0 cm |
| 40–44 | 11.1 cm | 23.3 cm | 35.2 cm | 16.4 cm | 30.2 cm | 42.3 cm |
| 50–54 | 10.7 cm | 22.1 cm | 33.4 cm | 15.3 cm | 29.1 cm | 41.1 cm |
| 60–64 | 10.3 cm | 20.9 cm | 31.4 cm | 14.7 cm | 28.8 cm | 41.0 cm |
| 65–69 | 10.1 cm | 20.3 cm | 30.5 cm | 14.5 cm | 28.9 cm | 41.3 cm |
P10 means the 10th percentile and P90 the 90th percentile. A result near P50 is around the middle of the reference distribution. It is not a pass mark.
Why women score higher on this test
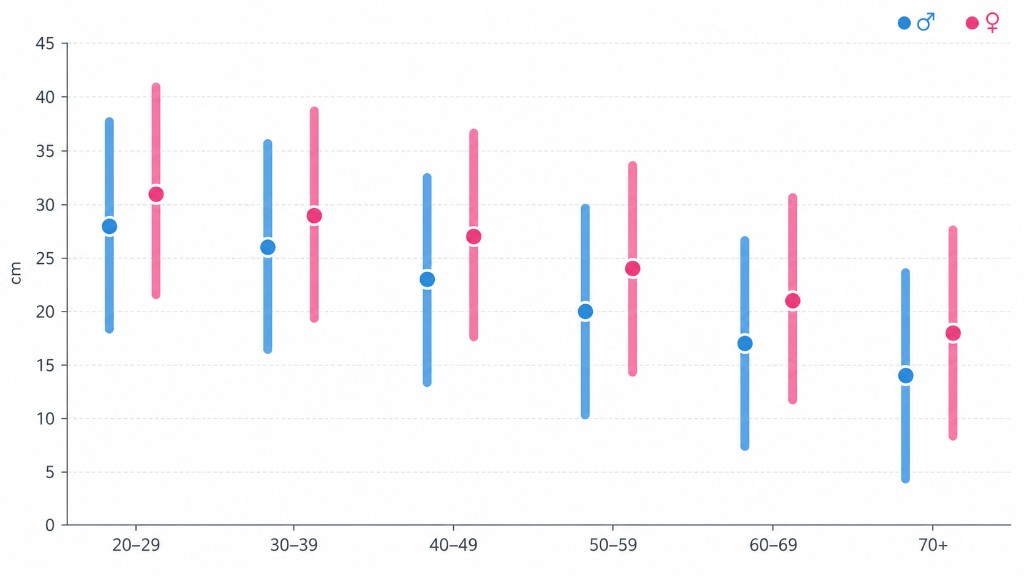
In the Canadian reference data, females had substantially higher sit-and-reach scores than males across age groups. That does not mean every woman is more flexible than every man, nor that the difference applies equally to every joint.
The sit-and-reach test is influenced by hamstring range, hip motion, spinal movement and body proportions. Differences in limb and trunk proportions can affect the distance reached even when two people have similar joint angles.
What the sit-and-reach test actually measures
The sit-and-reach is a convenient field test, not a direct measurement of whole-body flexibility. A meta-analysis of 34 validity studies found that sit-and-reach variants had moderate validity for estimating hamstring extensibility but low validity for lumbar extensibility.
Scores are also influenced by limb and trunk proportions, pelvic motion, technique and the exact test box or protocol used. That is why a centimetre score should not be translated into a diagnosis such as “tight back” or “healthy spine”. It is best treated as a repeatable performance measure under a standardized protocol.
Reference values are not diagnoses
A low percentile does not mean you have a medical problem. A high percentile does not guarantee healthy joints, strong movement or protection from injury. The table is descriptive: it tells us where people fell in one population sample.
This distinction is especially important for someone with naturally long limbs, hypermobility or a history of sport-specific training. The meaning of a score depends on context.
How the percentile should be read
There is extensive overlap between age groups: a person in their sixties can outperform the median for someone decades younger.
Suppose a 42-year-old man records 23 cm. In the Canadian table, the median for males aged 40–44 is 23.3 cm, so his result sits around the middle of that reference distribution. A result around 35 cm would be close to the 90th percentile for that group. Neither score says whether he has “good” or “bad” health; it only describes relative position in the sample.
Percentiles are also not linear grades. Moving from P10 to P20 does not necessarily require the same centimetre improvement as moving from P80 to P90. The underlying distribution matters.
Protocol matters more than people realise
Sit-and-reach values are only comparable when the test setup is similar. Different boxes place the zero point differently; some protocols use a modified sit-and-reach to reduce the effect of arm and leg length; warm-up and number of attempts can also change the score.
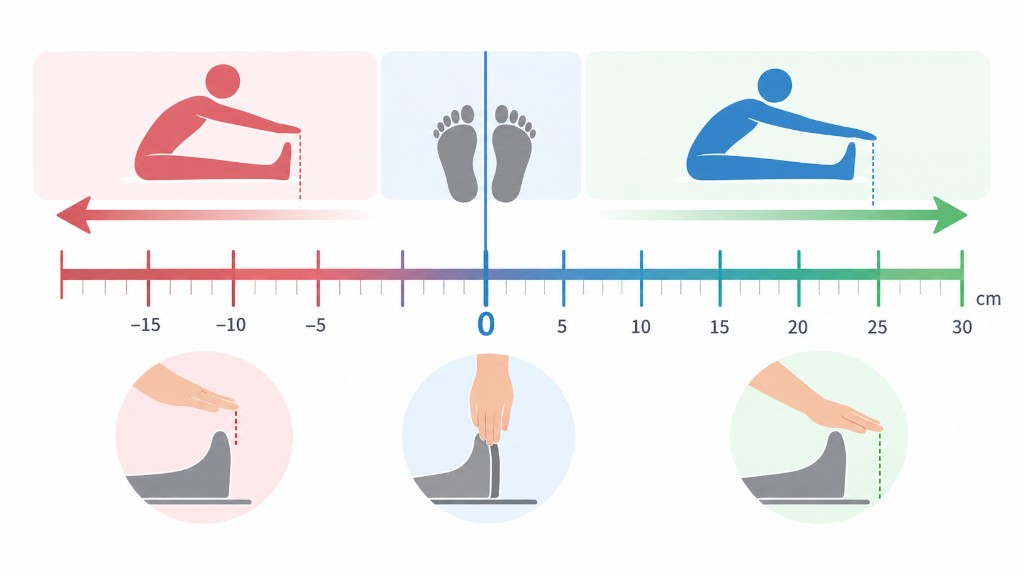
If you are tracking yourself at home, the most important rule is therefore consistency. A 2 cm improvement measured with the same setup over several weeks may be more meaningful than comparing your result with an online chart produced using a different protocol.
Why one number cannot describe whole-body flexibility
A runner may have average hamstring range but excellent ankle mobility. A swimmer may have exceptional shoulder range and an ordinary sit-and-reach score. A person with hypermobile joints may score highly yet lack strength and confidence near end range.
For a more useful personal profile, measure the areas that matter to your activities. Flexor already separates movement by body area for the same reason: “flexibility” is not one global property stored in the body.
Can you improve your percentile?
Yes, at least in principle. Large meta-analyses show that static stretching can improve measured range of motion across adults, and people with poorer baseline flexibility often show larger gains.
For example, a meta-analysis of 19 controlled studies in healthy young adults found average improvements of roughly 8–12 degrees across several hamstring range-of-motion tests after static stretching interventions.
But improving a test should not become the only goal. If your daily activities and sport do not require extreme hamstring range, moving from the 50th percentile to the 90th percentile may provide little practical benefit compared with improving strength, control or consistency.
A better way to track flexibility
For personal progress, repeatability is more valuable than chasing a population percentile. Use the same warm-up, test box or ruler position, footwear policy, time of day and number of attempts. Record the best or average score consistently. A two-centimetre change measured under the same conditions tells you more about your progress than comparing today's score with a table collected under a different protocol.
Use reference norms once, then focus on your own repeated measurement.
- Use the same warm-up each time.
- Use the same test box or measuring setup.
- Keep knee position and footwear consistent.
- Do not bounce.
- Record the best of a small number of controlled attempts.
- Repeat every few weeks, not every day.
For a broader picture, add a second measure relevant to you: ankle knee-to-wall distance, shoulder reach, hip rotation or a controlled squat depth.
Flexibility versus mobility
A sit-and-reach test mostly tells you about available range. Mobility asks whether you can actively control a range. Someone may score well in a passive forward reach but still struggle with active hip control, balance or strength.
This is why Mobility and Control can complement a more passive flexibility routine such as Full-Body Flexibility Builder. The first asks you to own range; the second can help develop it.
Does age mean flexibility training becomes pointless?
No. Research consistently shows that older adults can improve range of motion. A meta-analysis of acute static stretching in older adults found reductions in passive muscle-tendon stiffness, with no significant difference in the size of that response compared with younger adults in the available comparison studies.
The training context may need to change with age — balance support, joint health and medical conditions matter — but adaptability remains.
How to interpret your score
Use three questions:
- Where am I relative to a reference sample? The percentile gives context.
- Is this range sufficient for what I want to do? A cyclist, martial artist and office worker have different demands.
- Is my own score improving without pain? Personal trend is often more useful than population rank.
How to use age-based flexibility norms
Use the percentiles for perspective, then train for the range your life actually requires. They are not health cut-offs.
Sources and further reading
- Statistics Canada — Sit-and-reach percentile values by age group and sex
- Statistics Canada — Normative-referenced percentile values for physical fitness among Canadians
- Ingram et al. — Static stretching dose and flexibility meta-analysis
- Static stretching and hamstring flexibility meta-analysis
- Static stretching and passive stiffness in older adults
- Mayorga-Vega et al. — Validity of sit-and-reach tests for hamstring and lumbar extensibility (meta-analysis)
Put the guide into practice
Related Flexor routines
These guided routines are linked to the article topic. Review the difficulty and exercise list before starting.
Full-Body Flexibility Builder
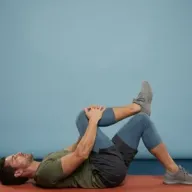
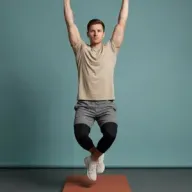
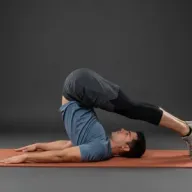
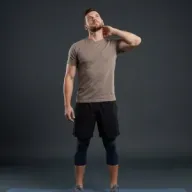
A 12-move advanced flexibility practice for spine, hips, hamstrings, and shoulders with dead hang, figure-four, hurdler, puppy pose, and plow.
-
-
-
-
-
- +7
Mobility and Control
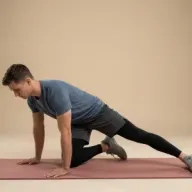
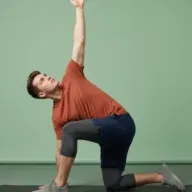
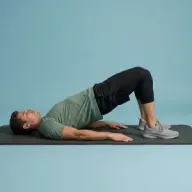
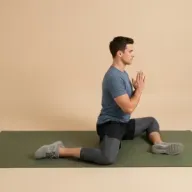
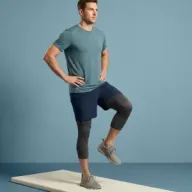
A slow 22-move session for end-range joint control — single-leg stand, dead bug, and 90/90 hip switches build active flexibility.
-
-
-
-
-
- +17
Quick Hamstring Ease
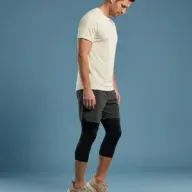
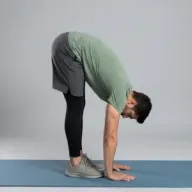
A 6-move posterior chain burst — hamstring scoops, toe touches, lying hamstring, and good mornings for tight backs of the legs.
-
-
-
-

-

- +1